Mapping programs in Cascadia show how inequities extend to climate, pollution risks

At least five large wildfires in 2020 torched thousands of acres each in the area around Grand Coulee, Washington, a town of about 1,000 people a few miles west of its namesake hydroelectric dam and 70 miles south of the Canadian border. One fire forced some residents to evacuate — just like blazes in 2018, 2016 and 2012. So it came as no surprise to Mayor Paul Townsend to learn that his town appeared on a map of Washington and Oregon communities facing heightened vulnerability to wildfire.
 What did surprise the mayor, owner of a local RV parts and repair business, was learning that Grand Coulee simultaneously faces above-average vulnerability to floods and extreme heat as well. “The town of Coulee Dam has higher flood risk than we do because of being right immediately below the dam,” Townsend told InvestigateWest.
What put Grand Coulee on those maps is not the likelihood or severity of extreme heat, flooding and fires. Those may be higher elsewhere. These maps identify communities whose populations are more susceptible when floods, heatwaves and wildfires strike.
And Grand Coulee comes out as the community most vulnerable to the triple threat in Washington state, according to research commissioned by InvestigateWest.
“You can have neighborhoods right next to one another and one may be twice as bad off during a flood. Not because they’re more flooded. But because their housing is worse,” said Michael Brauer, a professor at the University of British Columbia’s School of Population and Public Health.
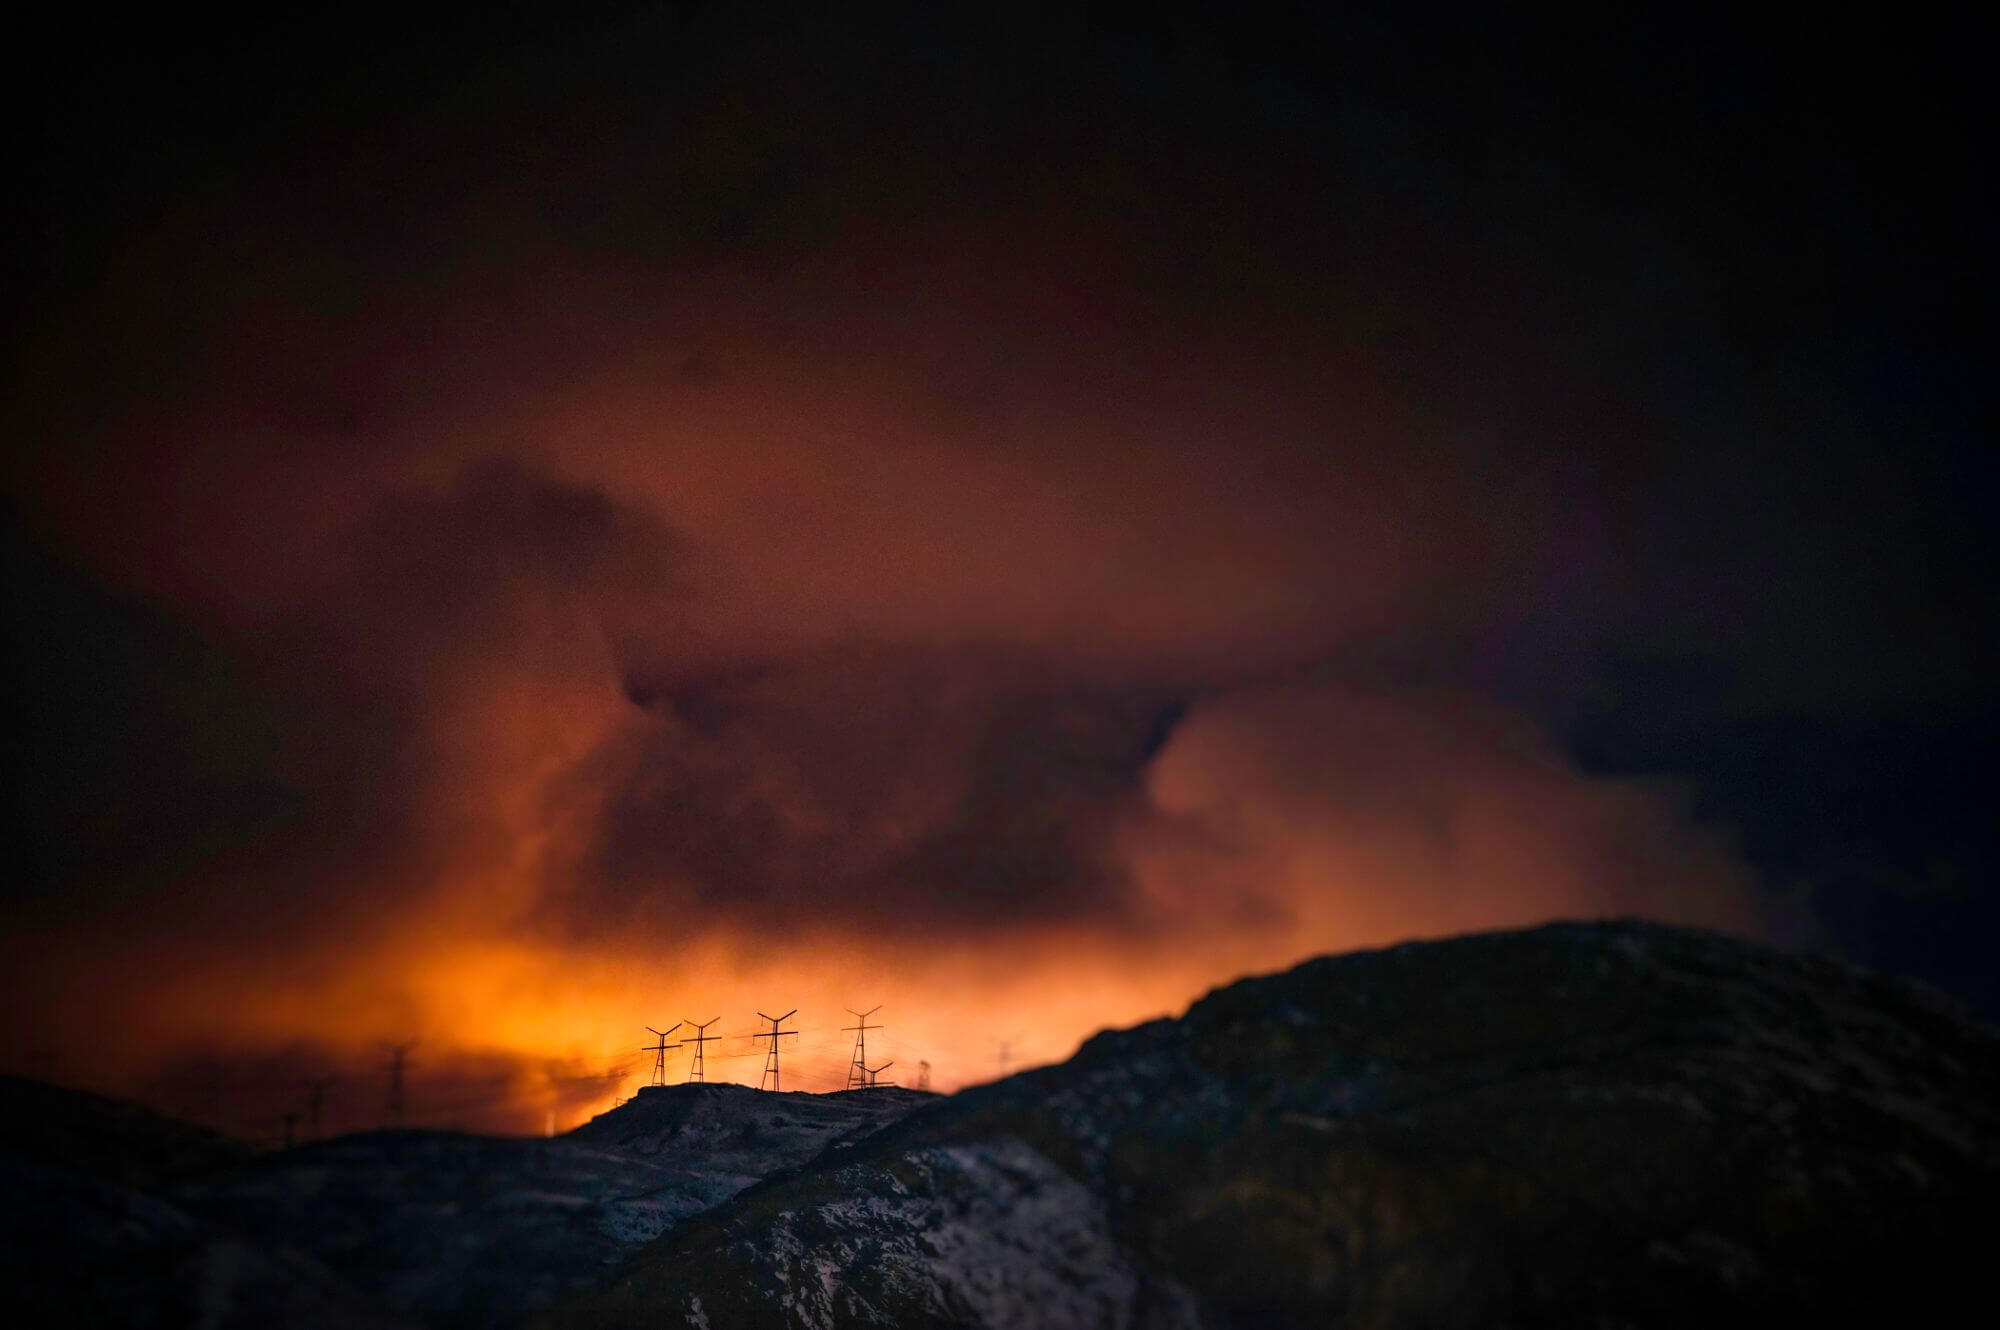
The glow of sodium vapor lights mixes with clouds above the Grand Coulee Dam, presenting an ominous glow resembling what an out of control range fire might look like in the high desert east of the Cascade Mountains. At least five wildfires scorched thousands of acres around the Town of Grand Coulee last year. The lack of trees in the town elevates its vulnerability to heat waves. Photo: Brian Plonka/InvestigateWest.
The maps, commissioned as part of InvestigateWest’s yearlong reporting project, Getting to Zero: Decarbonizing Cascadia, span Washington and Oregon and provide digital windows into vulnerabilities that are likely to worsen with climate change. Montana-based Headwaters Economics created the interactive visualizations using a pair of powerful mapping tools that the community planning firm launched last year.
The maps created for this project are an example of tools that are seeing growing use in Cascadia, where equity advocates, academic researchers and governments are teaming up to create new data-driven methods to identify and address unequal environmental risks. A movement that began several years ago accelerated in 2020 as the skewed death tolls from COVID-19 laid bare systemic social and economic inequalities on both sides of the border, and surging outrage amidst police shootings spurred governments into action.
These demographic maps are identifying environmental unfairness, engaging communities, and beginning to spur the redesign of government programs to target limited government resources where they can have the greatest impact.
Washington state agencies are beginning to use one of the first statewide systems for mapping environmental inequity, developed collaboratively in 2019 by Seattle-based climate justice coalition Front and Centered and the University of Washington. And in August 2020 the health authorities that serve metropolitan Vancouver deployed an interactive climate vulnerability map for their service territories developed for them by Brauer and his team at the University of British Columbia.
But a big challenge remains: ensuring that the tools accurately reflect and serve Cascadia’s Indigenous communities. Formal outreach with Tribes and First Nations about how these tools map inequity has either not happened yet, or has failed to elicit Indigenous feedback.
See it to change it
What all of these digital tools share is an overlay of environmental and demographic data. They do not merely reveal where, for example, the air is most fouled by exhaust from diesel trucks, or where future heat waves are likely to be most intense — especially if Cascadia, and the world writ large, continues to fail to slash greenhouse gas emissions. This sort of mapping adds information that tells us who lives nearby, and how they live. It identifies communities where environmental threats compound each other and where they may cause the greatest harm.
Consider wildfire vulnerability. Fire risk predictions by United States Forest Service scientists, developed for the agency’s Wildfire Risk to Communities tool launched last April, show that Washington and Oregon’s most intense wildfires are most likely to occur east of the Cascade Mountains.
But the interactive Wildfire Vulnerability map at right plots more than just communities facing heightened fire risk. It highlights those that face heightened risk as well as above-average levels of poverty and rental housing. It shows 152 communities across the two states, including some towns and small cities west of the Cascades. Such as Fife, a Tacoma suburb that’s at elevated fire risk and also has 61.5% rental housing, more than double the average for Oregon and Washington. Powers, a town in southwest Oregon, makes the map because it has fire risk and 21.5% of its roughly 1,000 residents lived in poverty as of 2018. That’s also double the regional average.
The socioeconomic factors matter because they limit residents’ ability to prevent fires by, for example, upgrading to fire-resistant roofing.
“Renters rarely have the autonomy to make such changes to their home, and families living in poverty may not have the financial means,” said Megan Lawson, an economist with Headwaters Economics.
How to Use the Maps
The vulnerability maps commissioned for the Getting to Zero: Decarbonizing Cascadia project spotlight communities in Oregon and Washington that bear greater attention as climate change worsens. The trio of maps highlight communities that face above-average risk of experiencing wildfire, flooding or extreme heat, as well as characteristics that make them more vulnerable.
Hovering over the dots brings up data boxes about the communities, and clicking on them creates a link where you can learn more. You can also pan and double-click to zoom in.
See InvestigateWest’s climate vulnerability mapping page for more technical information.
Lawson said helping community organizations and government target limited resources was one of the key goals for the Forest Service’s Wildfire Risk to Communities program. “If you’re just looking at physical exposure to risk, it could lead to a misallocation to places that are going to be able to rebuild or pop back more easily,” she said.
Visualizations for flooding and extreme heat commissioned by InvestigateWest similarly combine different socioeconomic factors to highlight communities at heightened vulnerability. The 60 communities vulnerable to flooding have above average flood risk plus above average poverty and racial and ethnic diversity. Poverty and systemic racism such as redlining practices trap families in low-lying areas, and Lawson noted that recovering can be more difficult because communities with low property values are less likely to qualify for federal grants.
The Heat Vulnerability map uses lack of tree cover as a proxy for extreme heat risk. The 75 communities with extreme vulnerability to heat in Washington and Oregon have above-average rates of people living in poverty, adults over 65, and people with disabilities. Extreme heat events can be deadly for the elderly and disabled, and those who also live in poverty may have less access to health care, have less insulated housing, and lack air conditioning — all factors that dial up danger during heat waves.
One observation that jumps out of all three maps: climate vulnerability is to be found across Cascadia.
Last month a reporter from Wenatchee asked the head of Washington’s Energy Policy Office what help the state’s newly released decarbonization plan offered to rural citizens, such as farmers and ranchers who use a lot of diesel fuel. Glenn Blackmon had a specific answer, noting the plan’s call for production of clean fuels, including hydrogen likely to be generated by utilities in eastern Washington.
But his first response was that decarbonization promised rural citizens reduced climate impacts.
“If we’re not successful in addressing climate impacts, rural areas will be among the hardest hit with things like wildfires,” Blackmon said.
With climate vulnerability maps, Cascadia’s rural residents and leaders can see what a changing climate means for their communities. Of course, that does not guarantee they will believe that climate change is responsible.
Mayor Townsend, in Grand Coulee, says he has “a hard time” seeing the connection. “I have mixed emotions about the whole climate change issue,” said Townsend.
Nor does better information guarantee that action will follow. Townsend, for one, acknowledges that Grand Coulee has vulnerable residents, but he said better information would be of little use without state and federal support.
“Some people have no financial resources for any kind of shelter. And of course our city revenues don’t have any margin for helping with that,” said Townsend.
Wielding information power
The data visualizations InvestigateWest commissioned take the climate threats of fire, heat and flooding one at a time, and layer on two or three relevant factors to show how vulnerability mapping works. But Headwaters Economics’ tools, and the interactive tools employed by activists and agencies, can create more sophisticated maps that simultaneously examine multiple threats. Tools created for Washington state and the most populous corner of British Columbia, in particular, do one better: They are equipped with science-based algorithms that crunch more than a dozen environmental risks and socioeconomic factors to rank which communities experience the greatest overall disparity.
Such cumulative ranking shines a brighter light on communities such as Grand Coulee, in the high desert of Washington’s Okanogan region, which is the one of only two communities that our maps show to be simultaneously extra-susceptible to fire, flooding and extreme heat. The other is The Dalles, a small Oregon city in the Columbia gorge that found itself dangerously close to several destructive fires during Cascadia’s record-shattering 2020 fire season.
How are these new tools being used?
Washington’s Department of Ecology was an early adopter of the Washington Environmental Health Disparities Map, completed in 2019 by Front and Centered and researchers at the University of Washington department of environmental and occupational health sciences and several state and regional agencies. For example, the agency used the map to parcel out some of the $141 million paid to Washington from legal settlements with Volkswagen after the automaker tampered with its vehicles’ tailpipe pollution controls. To date, over $61 million has been directed to highly impacted communities to purchase pollution-cutting equipment, such as electric school and transit buses.
Steering those funds means those communities are not being “left out” as Washington transitions to cleaner energy according to Esther Min, who led the interactive tool’s technical design as part of her Ph.D work at UW. “That’s how these tools really come to life,” she said.
The disparities map draws data from eight databases on 19 indicators of community health, including race and ethnicity, poverty, toxic releases from facilities, lead risk from housing, and low birth rate. Weighting algorithms then weave that data into 0 to 10 rankings of overall environmental disparity for each census tract in the state.
Min said that ranking makes the maps easy to understand, by design. “We wanted it to be trusted and evidence-based, but also easily used and thus widely applied,” said Min, who now works at both UW and Front and Centered.
Washington’s disparities map was inspired by a forerunner created for California, CalEnviroScreen, but adds important regional customizations, according to Min. For example, it includes transportation costs, in addition to housing costs, when calculating disposable income. Min said that provides a more representative measure for Washington’s rural areas.
Aurora Martin, co-executive director at Front and Centered, says more agencies are beginning to use the tool, including Washington’s Department of Health and Department of Natural Resources. The advocacy group hopes to also spur its use by affected communities to document their lived experience in the fight for more equitable treatment.
“Communities of color can really use it on the ground on a local level to effectuate local and broader policy changes,” said Martin.
A state environmental justice task force recently affirmed the map’s value, but also highlighted a lack of participation by Washington’s Indigenous communities.
The task force issued a final report last month calling the tool “robust” and its disparity rank “easy to understand” and “powerful.” It called for greater use, including “routine” use of disparities rankings to assess how agency programs may help or harm highly impacted communities and to set and track state goals for reducing disparities.
However, the state task force also noted some limitations, including the fact that Tribes were not formally consulted and business interests were not represented during the disparities map’s creation. Some Indigenous people wrote letters, spoke at a symposium or held community listening sessions, but there was no formal tribal government to government consultation, according to Front and Centered.
Failure to consult with Indigenous peoples fits a larger pattern: despite outreach by staff and members to five Tribal nations, the state was unable to fill a seat designated for a Tribal representative.
The report notes that this deprived the task force of “invaluable expertise, historical perspective, and ecological knowledge,” and decried the ongoing failure unacceptable: “State government is accountable to repairing the environmental harms done to Tribes and Indigenous communities, and the path towards healing that harm includes meaningful and authentic relationships.”
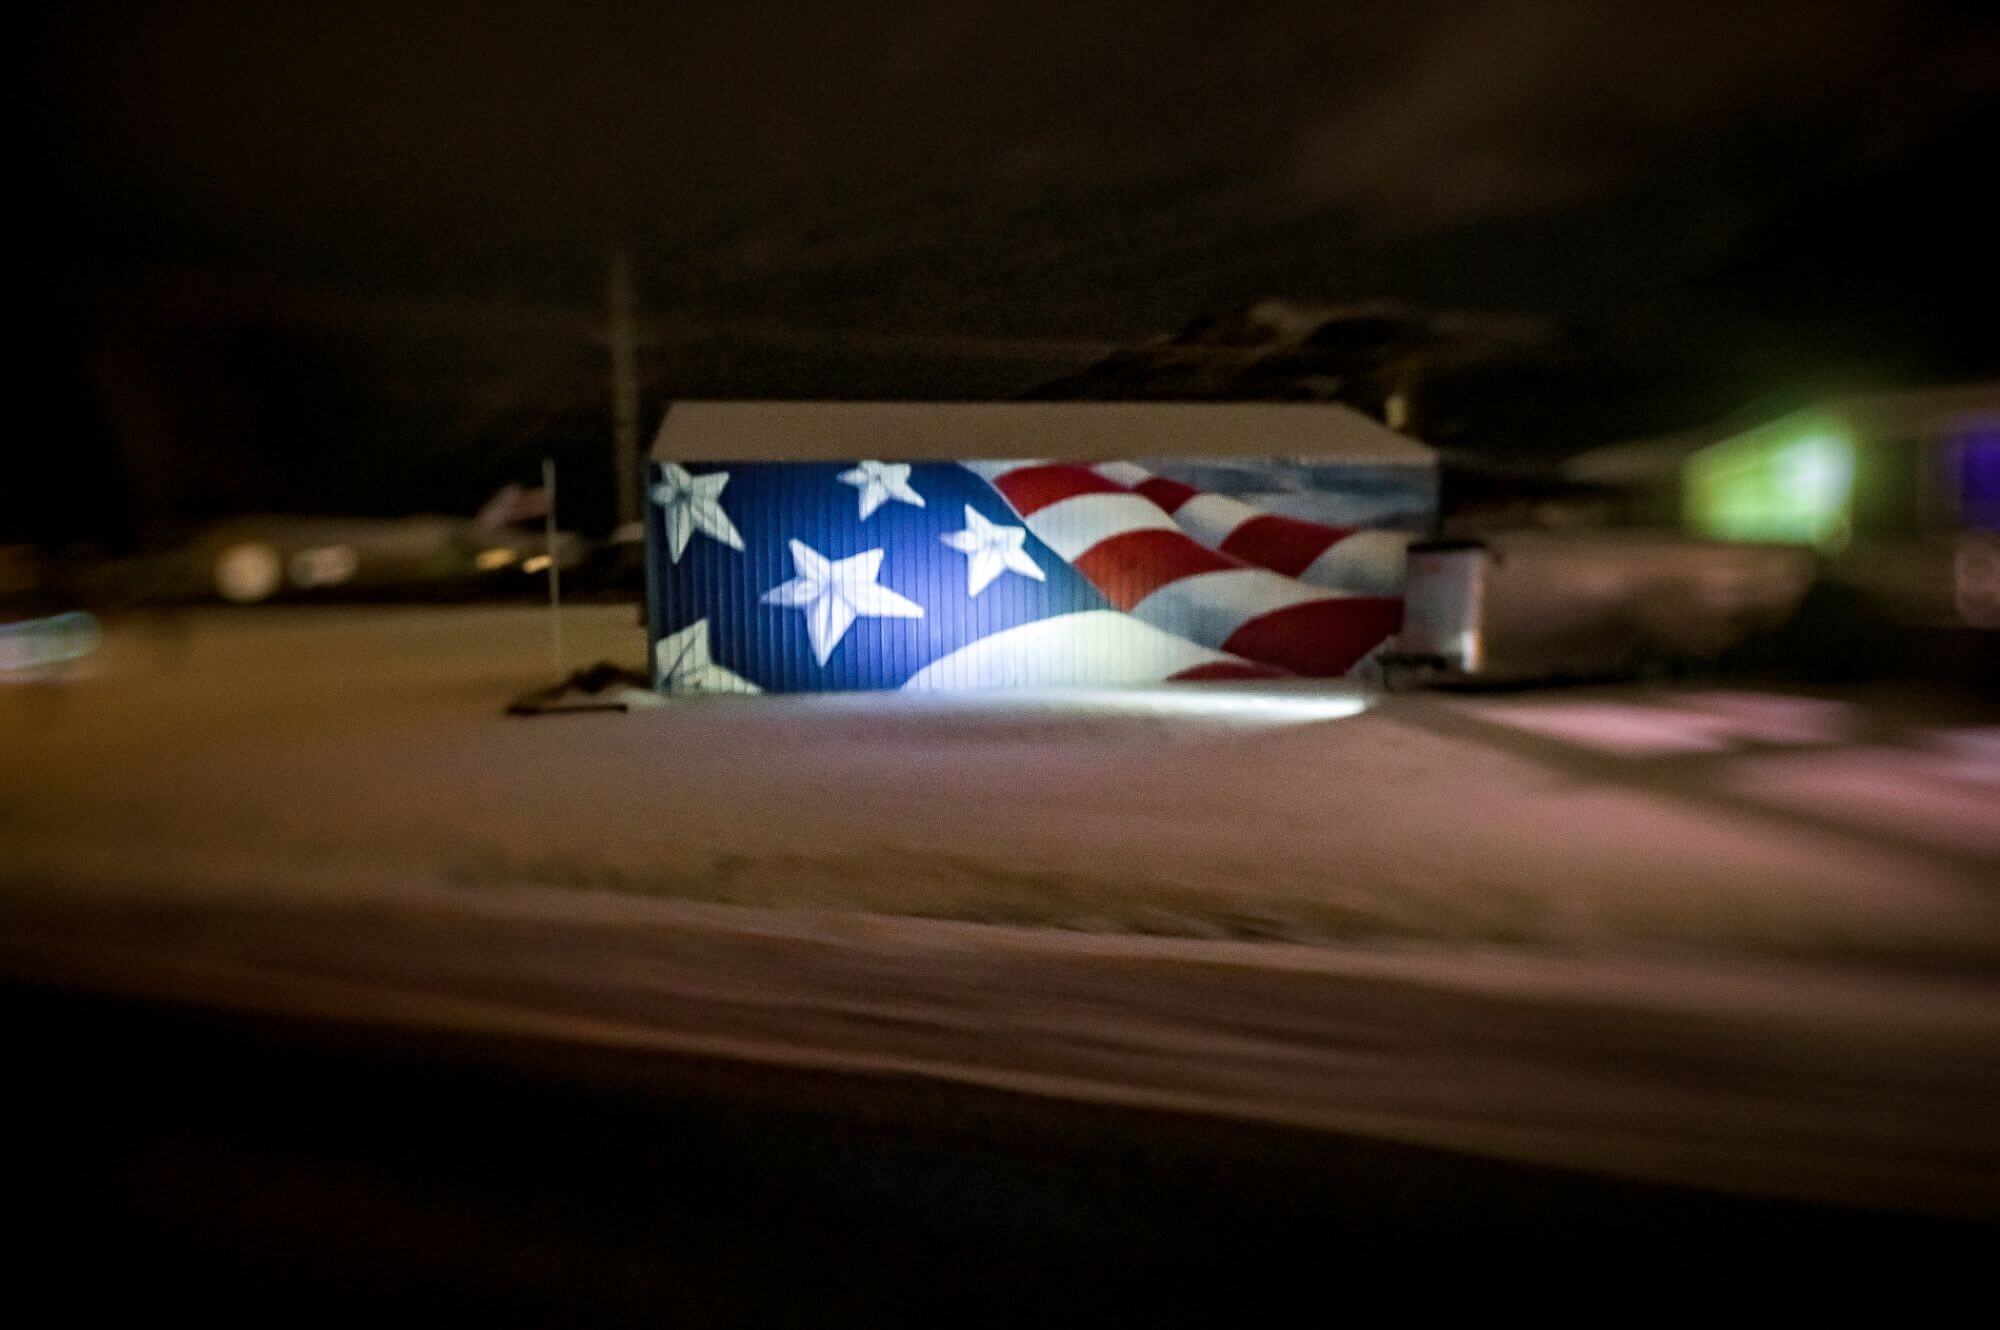
The garage next to a home in Grand Coulee, a town where one in four residents are people with disabilities, more than one-fifth of the population is older than 65, and about one-sixth of its residents live in poverty. About 30% of residents are people of color, according to the 2010 Census, and half the town’s population lives in rental housing. Those characteristics make it more difficult for people to avoid and recover from climate-fueled disasters. Photo: Brian Plonka/InvestigateWest.
Predicting vulnerability
Expansions are also underway, north of the 49th Parallel, for the metropolitan Vancouver-centered Climate Vulnerability Index launched in August. One upgrade in the works: models that compare vulnerability across smaller areas, such as the City of Vancouver. “This makes the results more relevant to local decision-makers,” said Craig Brown, who leads the Climate Change and Health Adaptation program for Vancouver Coastal Health, one of British Columbia’s five health-care delivery authorities.
New territory is also being added. As launched in August, the tool maps climate vulnerability across the areas served by Vancouver Coastal Health and Fraser Health, the metro Vancouver-based authorities that commissioned its development at UBC. But Brown said work now underway at Kelowna-based Interior Health authority will extend climate vulnerability mapping to the Alberta border.
As with the Washington tool, British Columbia’s combines data on environmental exposures, health and community makeup to create an overall vulnerability score. However, it raises the bar technically by mapping future heat, floods and fires predicted by climate models, rather than relying on historical data. That look ahead may be especially important for accurately responding to flooding in coastal areas, as sea levels are rising and may outpace pessimistic forecasts.
The focus for the map was helping British Columbia communities adapt to climate change. For extreme heat events, the maps can identify neighborhoods where municipalities should focus resources to open cooling centers, for example, or where social networks need strengthening.
Brauer, at UBC, said social outreach can be crucial for elderly and disabled people living alone: “There’s no reason people have to succumb to a heat event except that they’re not connected — that people aren’t looking out for them. We can change those things so that a heat event that would have killed people 30 years ago doesn’t.”
Brauer said further vulnerability mapping in the province should prioritize stronger involvement by First Nations. He said his team’s informal discussions with First Nations revealed that the researchers lacked data to fully reflect Indigenous communities, such as the strong community bonds they report.
People living in some rural areas and small towns are far more vulnerable to climate change than people inhabiting Cascadia’s large cities, the data analysis by Headwaters Economics shows. Near this scene on the Colville Reservation, the analysis reveals heightened vulnerability to wildfires in Nespelem, a town on the reservation where more than one in five people live under the poverty line, and where two in five homes are rental houses. Photo: Brian Plonka/InvestigateWest.
Several Tribes and First Nations in Cascadia, including the Swinomish Indian Tribal Community, the Lummi Nation, and the Tsleil-Waututh Nation have defined community-specific metrics for health and climate risk. The Swinomish, for example, “Indigenized” a climate resilience framework used by the U.S. Centers for Disease Control to forge its own community environmental health program that incorporates Indigenous concepts of health and decision-making. Doing so prioritized factors that are missing from conventional public health assessments, such as climate impacts on shellfish and other traditional foods.
“To make decisions that reflect community priorities, communities require information about the consequences of climate change on things that they care about,” according to a December 2020 health journal article co-authored by two members of the Swinomish community health team.
InvestigateWest requested comment on regional mapping efforts from health experts at several Tribal nations and BC’s First Nations Health Authority but did not hear back by press time.
Brown, at Vancouver Coastal Health, said efforts to consult with First Nations, put on hold during the COVID-19 pandemic, will begin “soon.” But he said local governments are already using the maps to “build awareness and political will” for climate-driven action among their staff and elected officials, according to Brown. BC’s Ministry of Environment and Climate Change Strategy says that the climate vulnerability index tool is contributing to the development of a Climate Preparedness and Adaptation Strategy.
Brauer noted that, by communicating that climate change will have real and local impacts, the mapping could also spur more serious action to slow the growth of greenhouse gases. But for that to happen, people across Cascadia, including the likes of Mayor Townsend, may need further convincing that climate change is putting them and their communities at risk.
Clarification: This story has been updated to reflect that although no formal consultation occurred between the Washington task force and tribes, some tribal members wrote letters, spoke at a symposium or held community listening sessions.
Editor’s Note: This story is part of the series Getting to Zero: Decarbonizing Cascadia, which explores the path to low-carbon energy for British Columbia, Washington and Oregon. This project is produced in partnership with InvestigateWest and other media outlets and is supported in part by the Fund for Investigative Journalism.
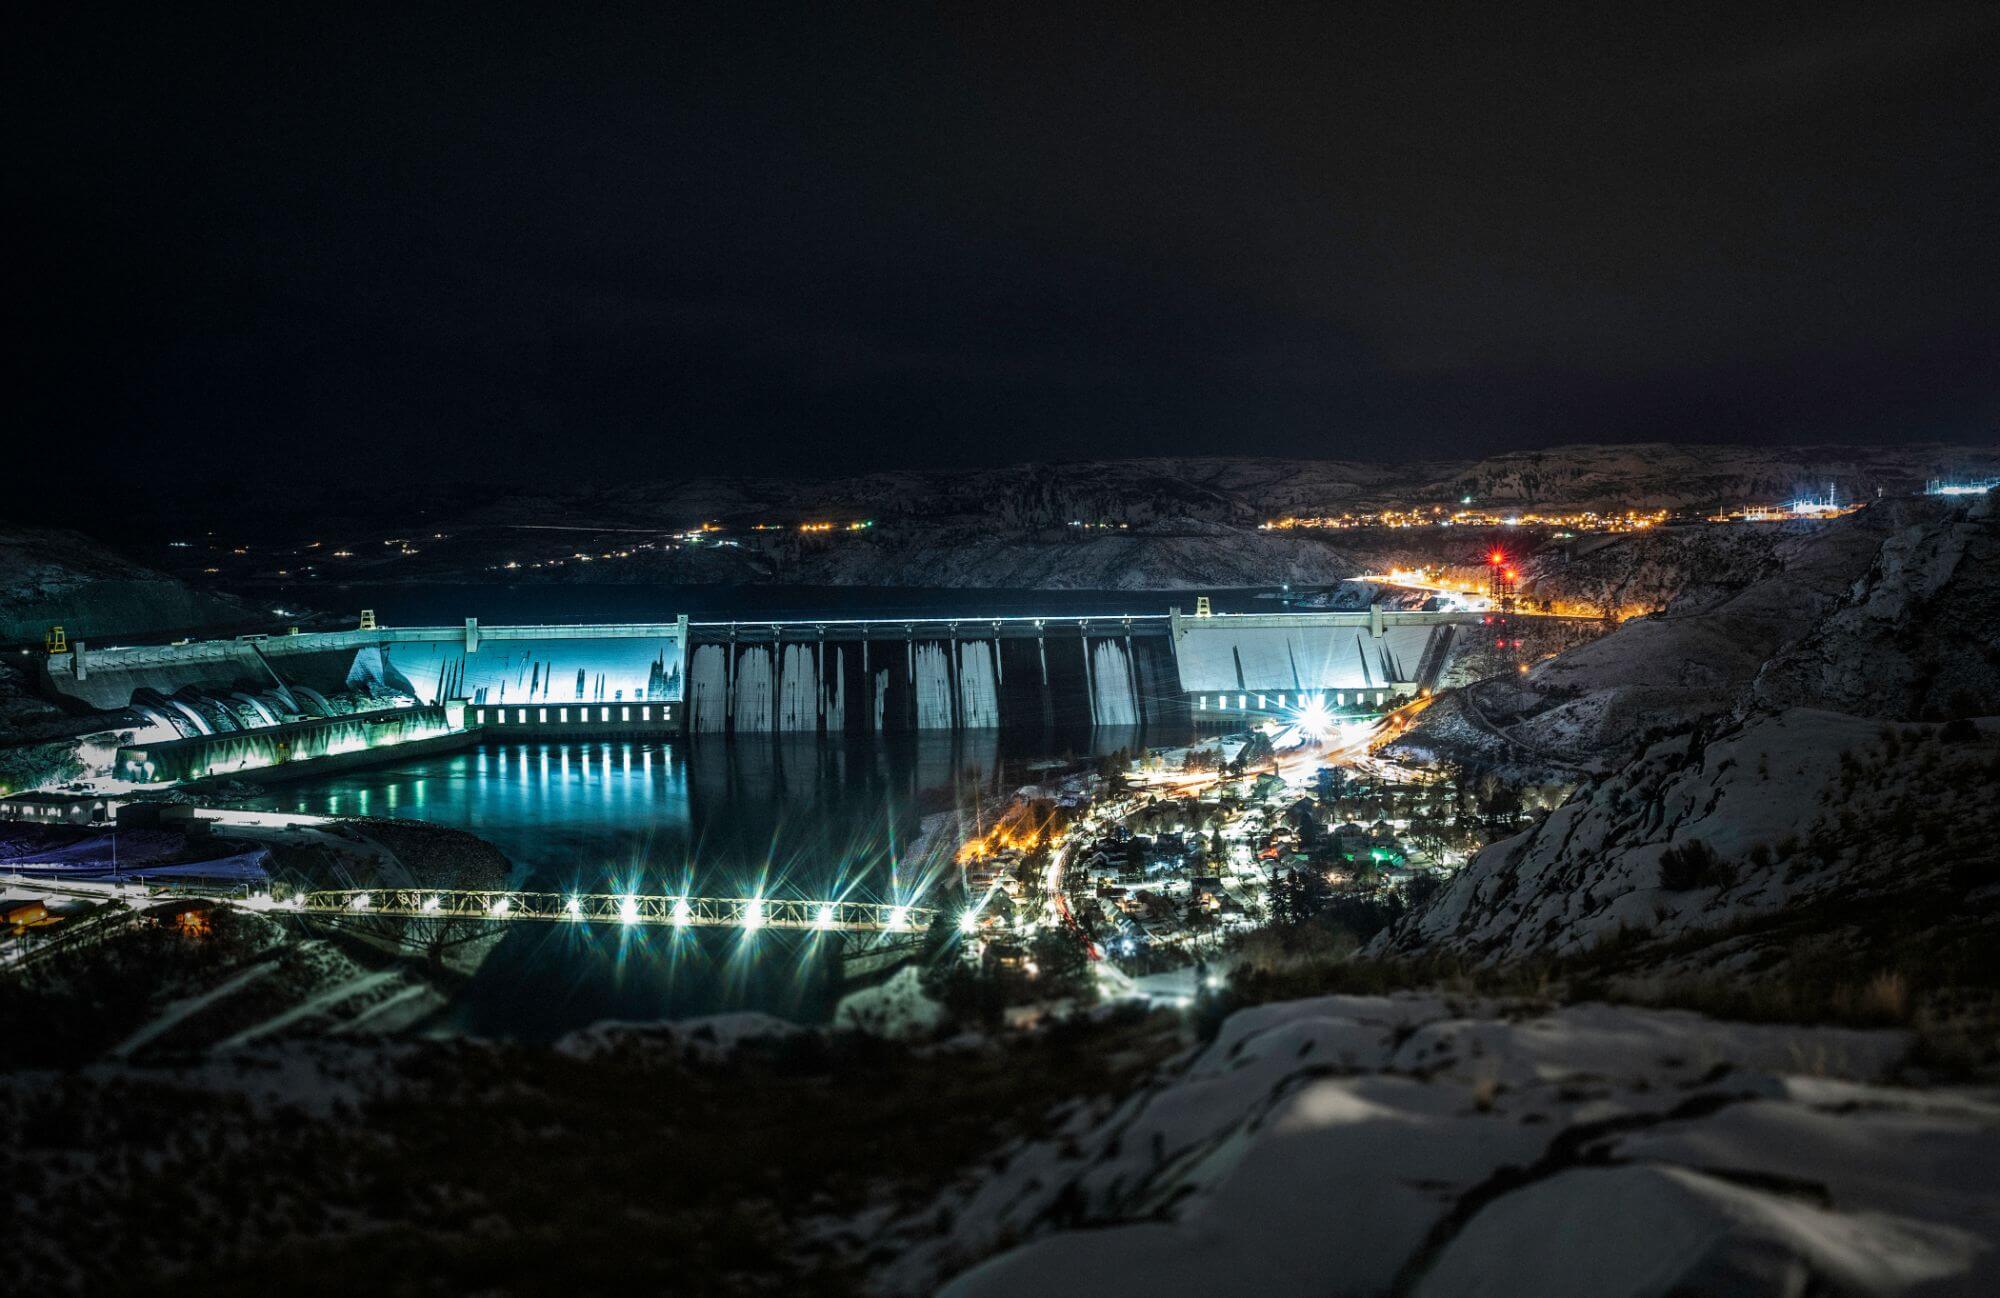
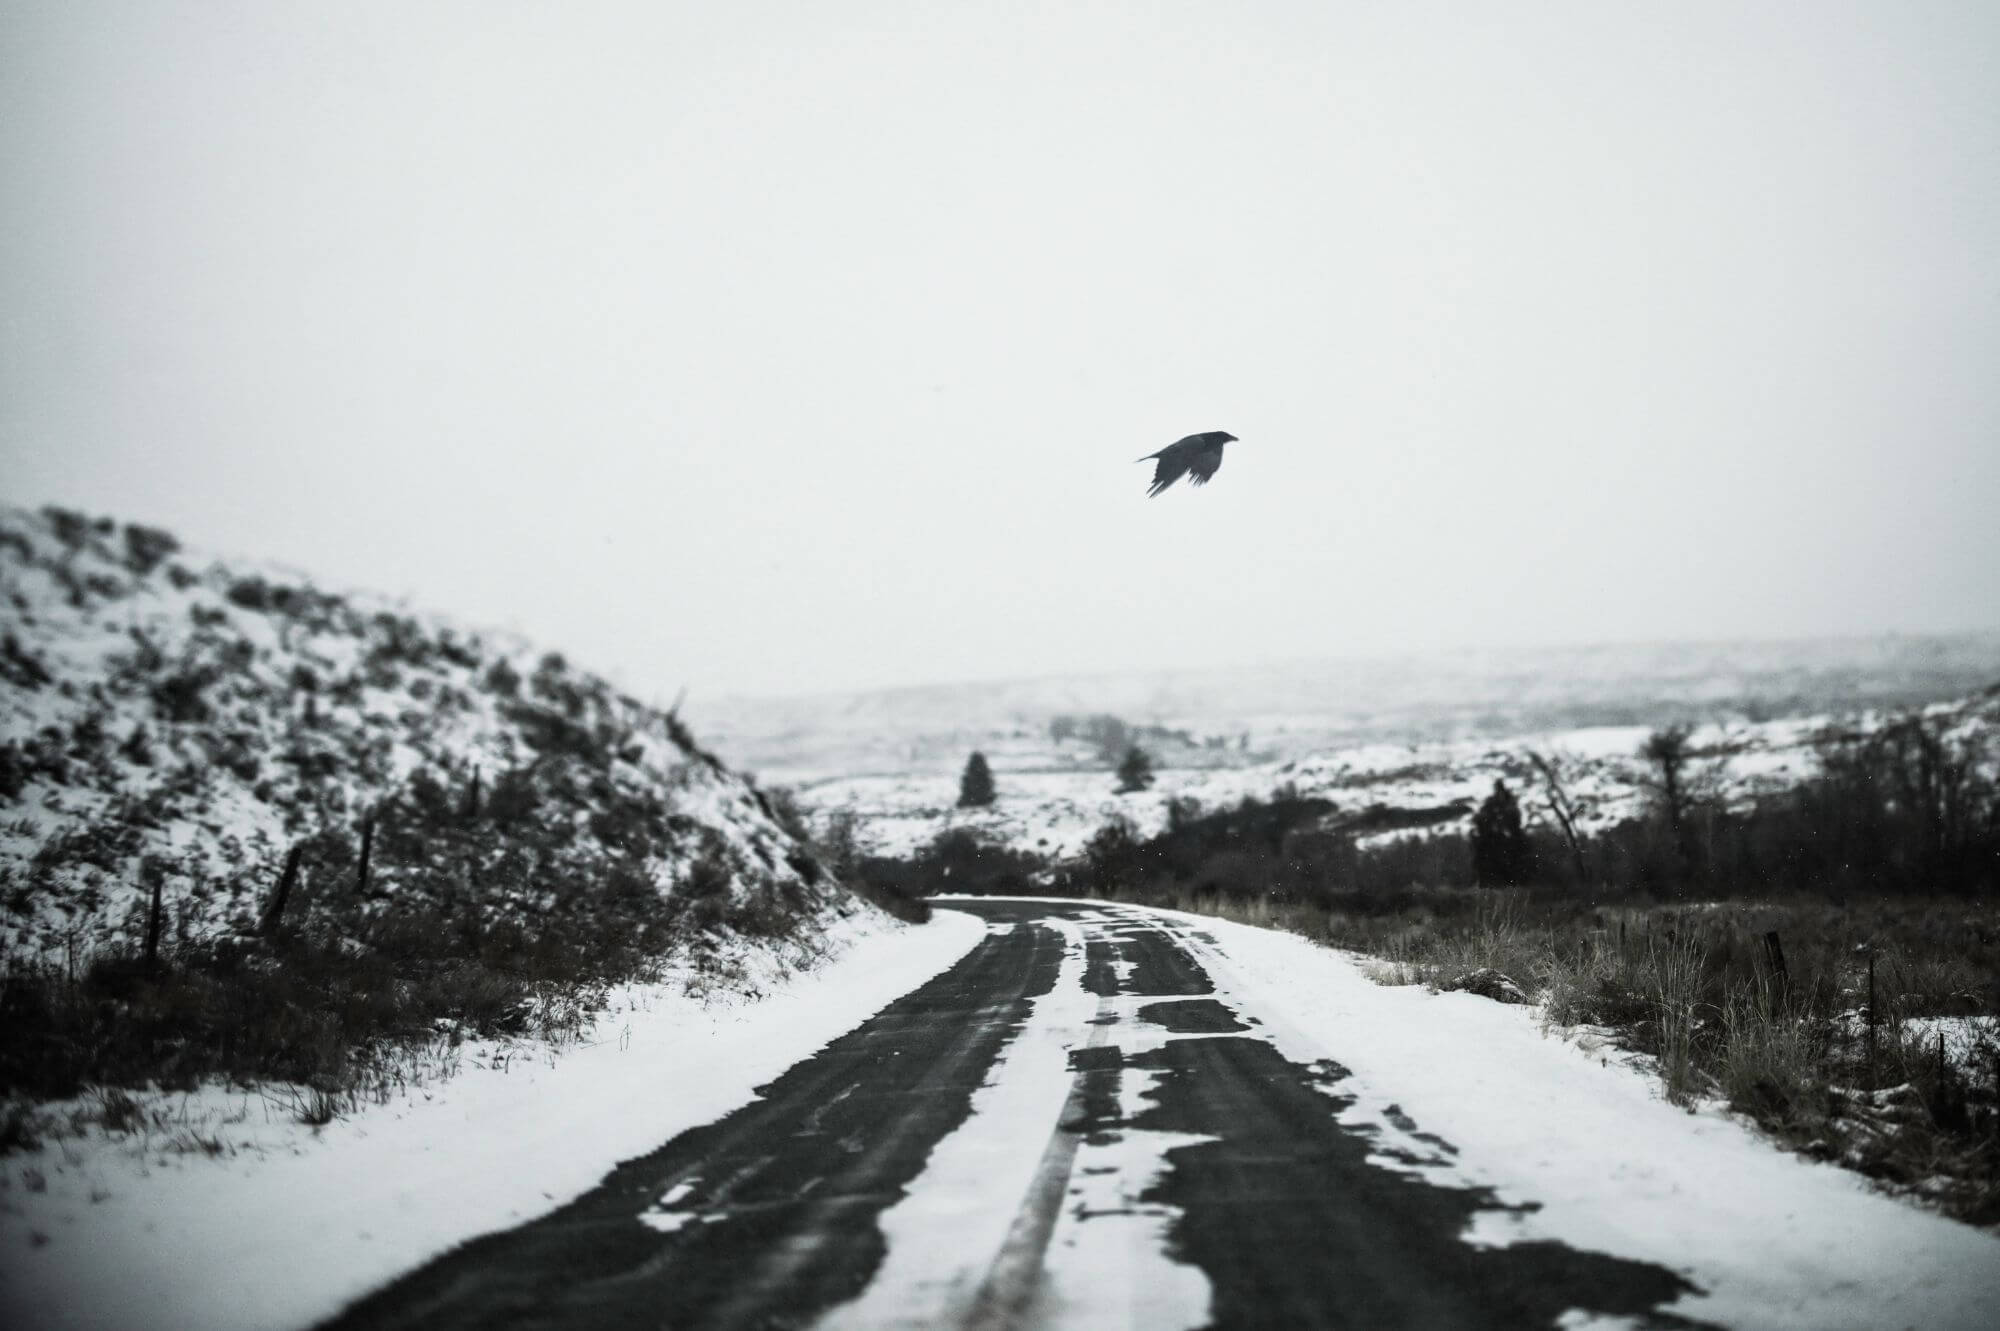
Feature Image: The Town of Grand Coulee, just downstream from the Grand Coulee dam, is the town in Washington that is most vulnerable to the climate-change triple threat of flooding, wildfire and dangerous heat waves, according to research commissioned by InvestigateWest. Headwaters Economics used sophisticated mapping and data tools to pinpoint towns and governments across Washington and Oregon where residents’ socioeconomic characteristics combine with these threats to put them at highest risk. Photo: Brian Plonka/InvestigateWest.
Next Week in Getting to Zero:
People of color, low-income communities and other marginalized groups are disproportionately impacted by the effects of climate change, according to community activists around Washington, Oregon and British Columbia. From country towns to diverse urban landscapes, activists say the government is not yet fully hearing from the long-marginalized communities that are feeling the biggest effects of climate change.
The featured image shows the city of Grand Coulee only in the background. It actually overlooks part of the city of Coulee Dam, which is not mentioned in your report. The population cited for Grand Coulee of a little over 1,000 is correct, but add in Electric City, Coulee Dam and Elmer City to complete the chain of small towns that make up the community all within a few miles of each other, plus the unincorporated areas between and beyond them, and the population is more like 4,000. This would be hard for researchers to discern from data alone and it may mean the map is skewed in more places than this one. All that said, the wildfire risk to this community is likely understated as several evacuations have been necessary in recent years, but never before. They’re getting worse.