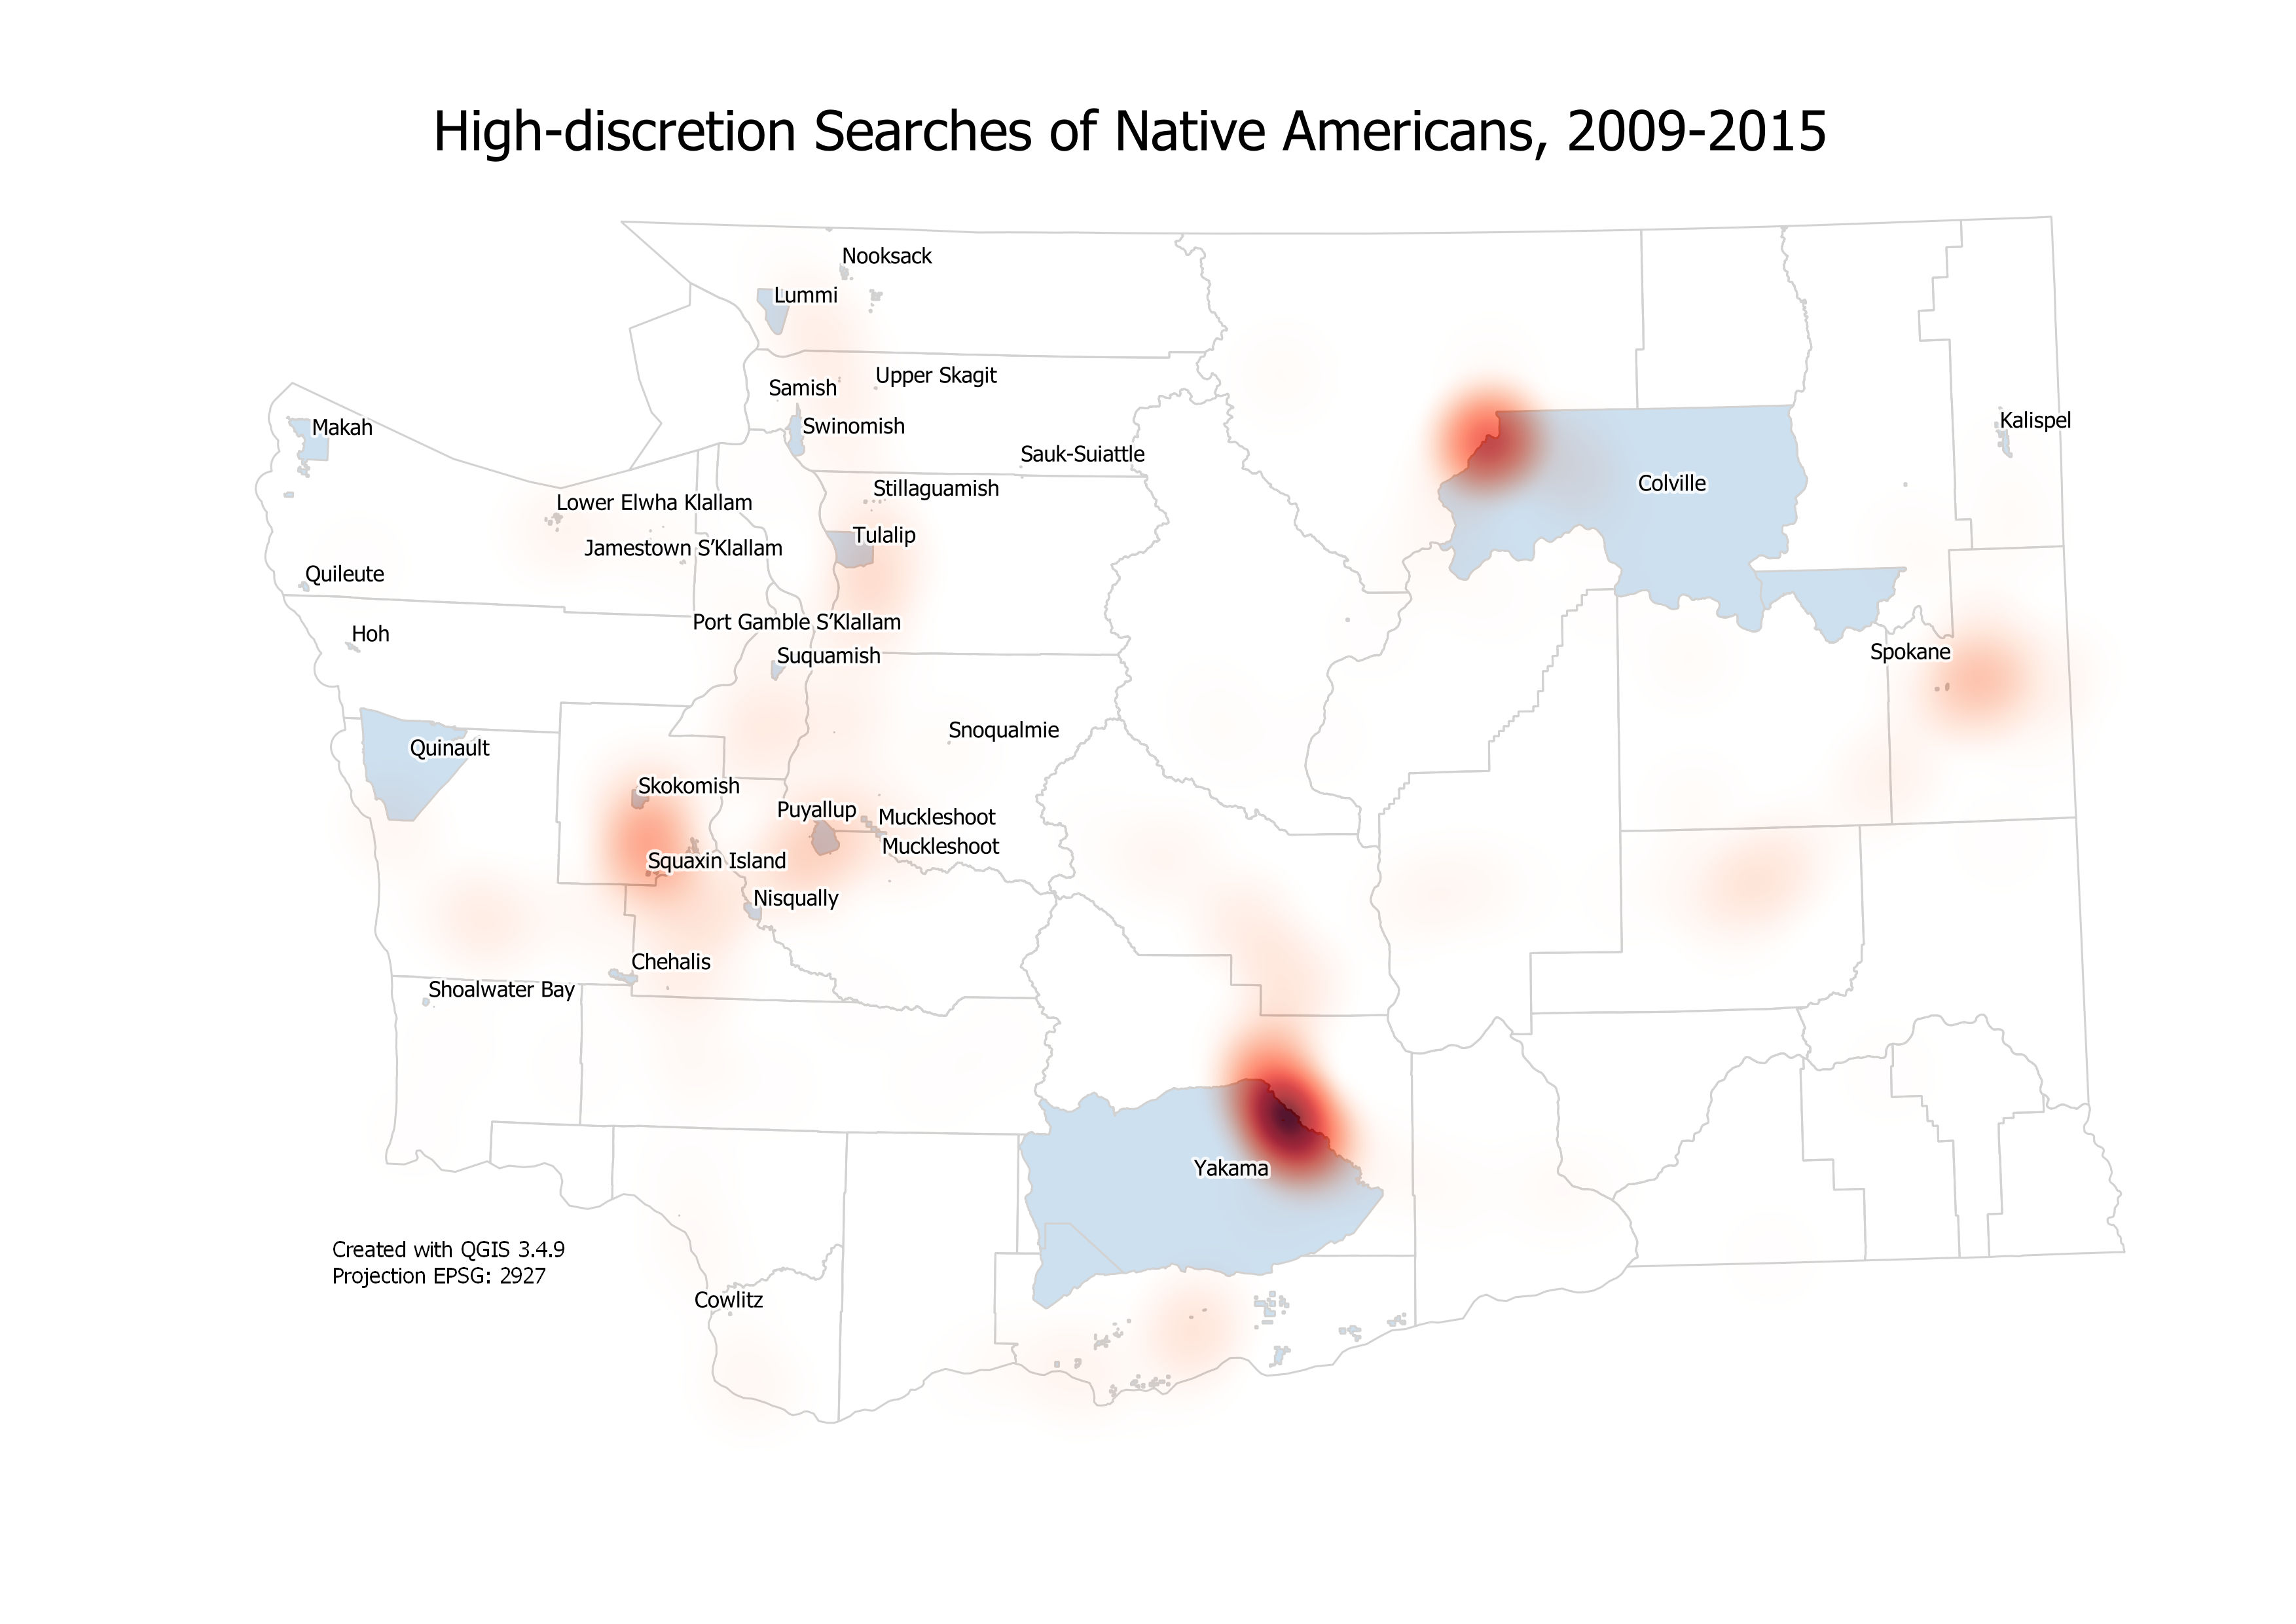
This map shows where Washington State Patrol troopers conducted searches of Native American motorists from 2009 to 2015, as well as the locations of Indian reservations. These were searches in which the trooper chose to initiate a search even if not compelled to do so by law or regulation. Source: Stanford University Open Policing Project/Washington State Patrol
To conduct the analysis for this week’s Driving While Indian project, InvestigateWest used data obtained by Stanford University’s Open Policing Project through a Public Records Act request to the Washington State Patrol. The project makes the data publicly available to journalists, researchers and the public.
Stanford analyzed race and ethnicity data from the Washington State Patrol and 20 other state law enforcement agencies around the country. The Patrol keeps some of the most detailed data of any state police agency in the U.S., thanks in part to a law Washington legislators passed in 2000 requiring troopers to record the race and ethnicity of everyone they stop. Troopers don’t ask for that information. They record it based on their perceptions. Despite the potential for inaccurately recording someone’s race or ethnicity, relying on troopers’ perceptions is considered an acceptable way of testing for bias, according to researchers.
“You want to know the officer’s perception of race and ethnicity. That’s what can indicate a bias as well,” said Cheryl Phillips, a journalism professor at Stanford and cofounder of the Open Policing Project. “But you want to make sure you’re accurately recording the data. What matters is the perception and whether that colors the officer’s actions in any way.”
As a reporter for the Seattle Times, Phillips in 2003 conducted an analysis of Washington State Patrol stops that found results similar to InvestigateWest’s.
Rather than looking at how often a racial or ethnic group is stopped, an imprecise way of measuring for bias because it’s impossible to know the demographics of who’s on the road, InvestigateWest compared how often different racial and ethnic groups are searched and how often troopers find contraband.
By looking at the demographics of who state troopers stop and how often they’re searched, InvestigateWest was able to determine the rate at which state police search members of the racial and ethnic groups recorded in the data. The Washington State Patrol conducted more than 8 million traffic stops from 2009 to 2015, the most recent data publicly available from Stanford, and more than 198,000 searches. The vast majority of those searches are what are known as low-discretion searches, such as searches that must be performed in the course of an arrest, when officers have little leeway about whether to pat someone down. InvestigateWest disregarded those.
Instead, InvestigateWest focused on 21,663 high-discretion searches, when officers weren’t required by statute or policy to search someone or their car. When looking at, say, black drivers, who accounted for 1,812, or 8.4 percent of the high-discretion searches conducted from 2009 to 2015, the analysis does not compare incidents in which troopers searched black drivers to the total number of searches. Rather, the analysis used the total number of black drivers stopped, 287,939, and calculates how often those drivers were subjected to high-discretion searches, 0.6 percent of the time.
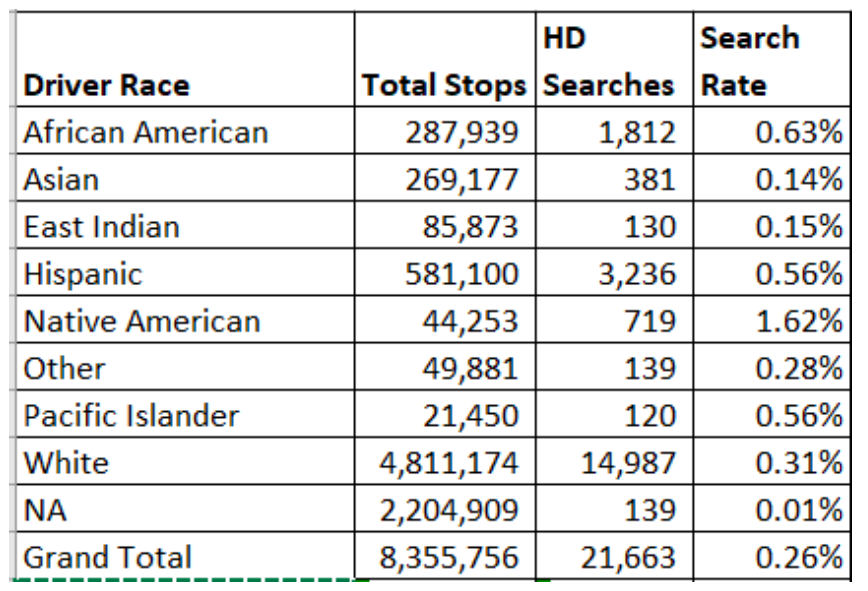
So troopers search black, Latino, Native American and Pacific Islander drivers at a higher rate than white drivers — much higher, in the case of Native Americans. Drivers identified as Asian and East Indian were searched at a lower rate than whites.
None of this is proof of bias, according to researchers. Search rates alone can’t determine whether any of those groups are committing crimes more often than whites. That’s where a key part of the threshold test comes in.
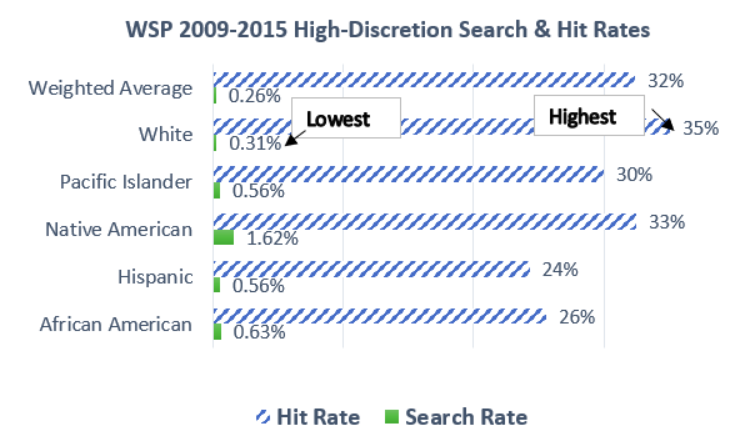
InvestigateWest compared the search rates to the hit rates, or how often troopers found contraband like drugs or weapons. Our findings are in the accopanying table and charts.
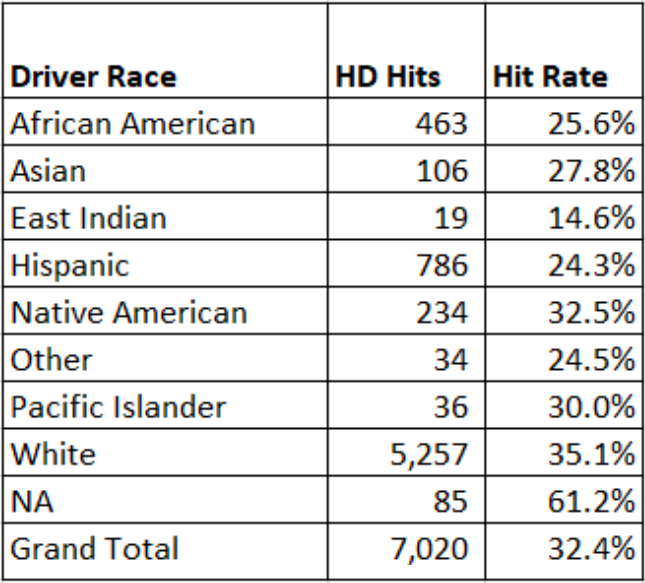 So while black, Latino, Native American and Pacific Islander drivers were searched at a higher rate than white drivers, troopers were actually more likely to find drugs, weapons and other contraband when searching white drivers.
Stanford, using a more sophisticated test that accounted for other factors, found the same disparity for black and Latino drivers compared to white motorists in the wake of marijuana legalization in Washington, but did not analyze Native American drivers. This is evidence that police have a lower threshold — the analysis that Stanford ran happens to be called the threshold test — for searching those groups, and it’s evidence of bias.
“Is the standard an officer decides to search a white driver compared to a black driver different?” Phillips said. “And what we found is yes, they search drivers of color more often and find contraband on them less often. And it appears they have a lower threshold for searching, they have a lower bar for when and why they search.”
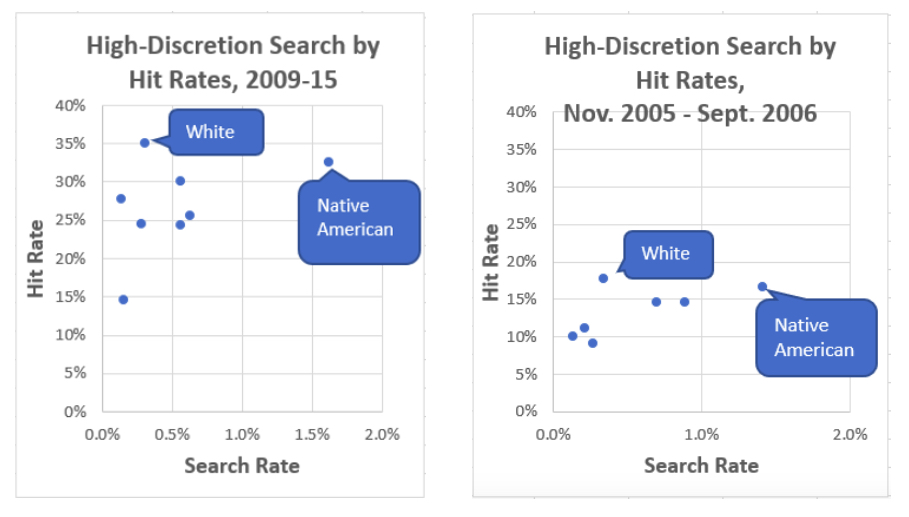
Source for 2005-2006 data: Washington State University 2007 report on Washington State Patrol
Data: During the course of this project, Stanford renamed some fields and reloaded the WSP data. In the process, there was a glitch and the raw driver race field is empty. As soon as that is fixed, InvestigateWest will post the R code used to analyze the data. We also anticipate that 2016-2018 data will be added, and will post our analysis.
This story has been updated to clarify that Stanford University’s Open Policing Project employed a more sophisticated analysis than InvestigateWest. Stanford researchers used a complex statistical tool called the threshold test that takes into account a range of factors, including a driver’s age and gender.