In an analysis of recent voter data and behavior, InvestigateWest found that voters with Latino surnames in Washington state were more than twice as likely to have their ballots rejected because of signature mismatch.
In the eight counties with the highest share of potential Latino voters, rejection was four times more likely.
The findings are based on analysis of responses to nearly 50 public records requests to two state agencies and the eight counties, covering 11 million votes cast statewide over four elections.
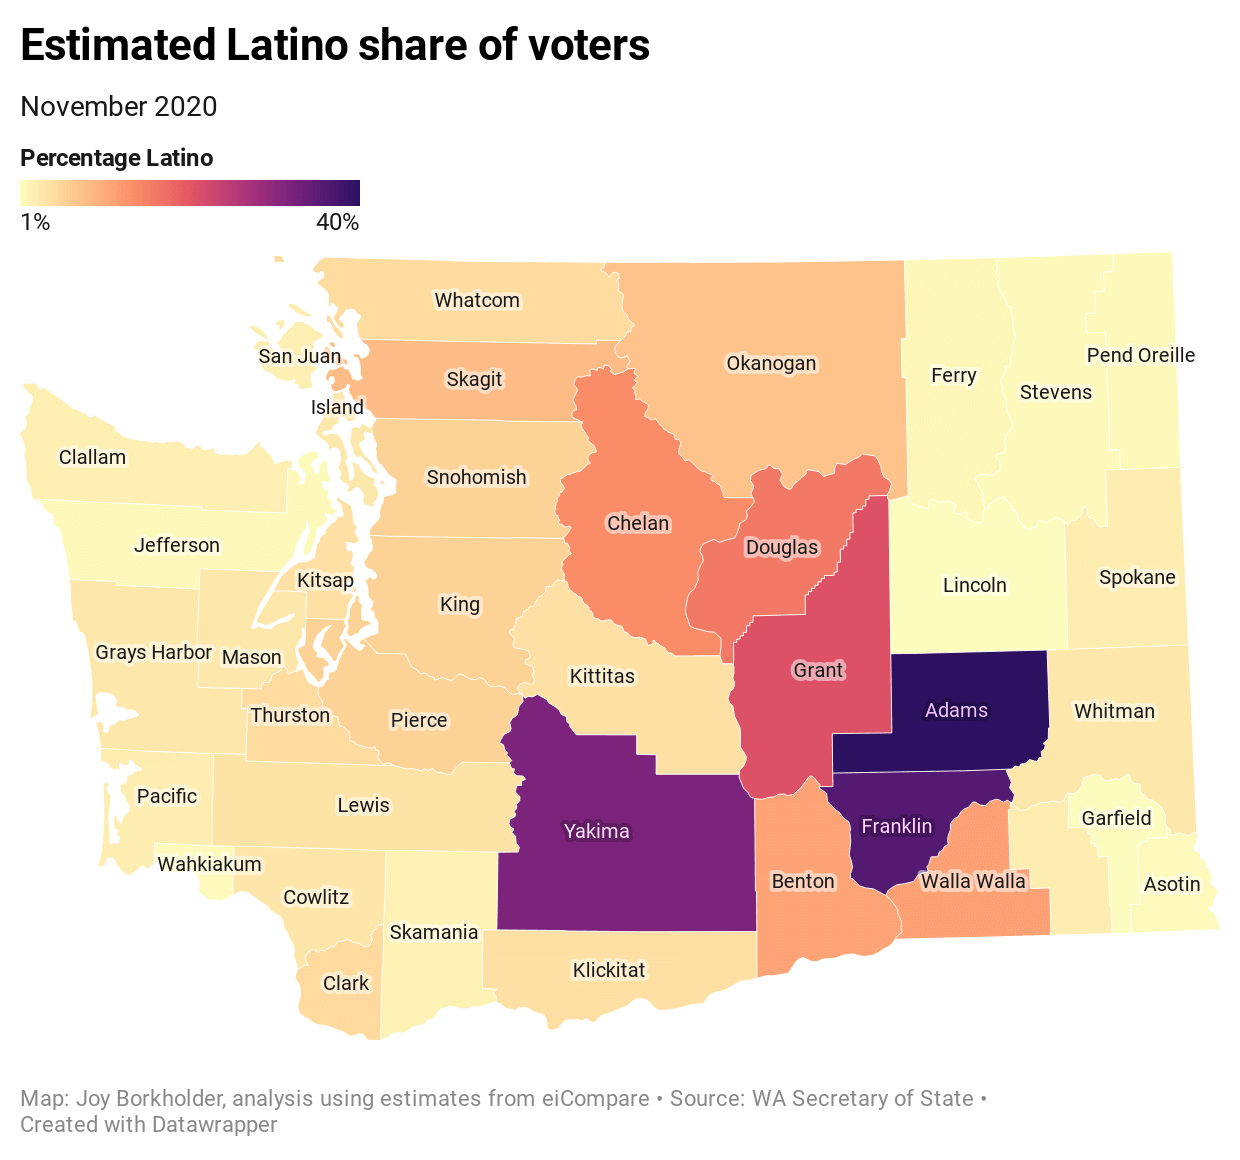
The analysis covered eight counties in Central and Eastern Washington with the highest share of Latino voters, plus King County. InvestigateWest looked at data from four general and primary elections in Adams, Benton, Chelan, Douglas, Franklin, Grant, Walla Walla and Yakima counties.
Among the data collected and analyzed were the U.S. Census American Community Survey to rank counties by Latino share of estimated citizen voting-age population, known as the CVAP, choosing the top eight out of 39 counties. That roughly equals the top one-fifth of counties in Latino share of CVAP.
Latinos make up 37% of the total population in these eight counties and 21% of the voting population. Looking at it another way, while the eight counties account for 10% of the statewide voting population, they account for 29% of the Latino voting population. White, non-Hispanic voters make up most of the remaining voting population in these counties.
Because of a consent decree stemming from a federal Voting Rights Act lawsuit, the Washington Secretary of State matches Yakima voter last names to a “Spanish surname” list provided by the U.S. Justice Department in 2004.
Yakima County also provided to InvestigateWest the actual Spanish surname list. From there, InvestigateWest used Yakima County’s challenged ballot reports across multiple elections, added the Spanish surname field, and used Yakima’s data on each election’s total voters with and without a “Spanish surname.”
The results show a persistent gap of voters with Spanish surnames having a higher rate of signature rejection.
InvestigateWest worked in RStudio, a software program for statistical computing in the language known as “R.” A data set (“data frame”) was created using three different types of data from the Washington Secretary of State: the voter registration database, ballot status reports for each election, and a list of ballots with cured signatures.
The status reports, available for anyone to download, show which ballots were rejected for a signature mismatch. With the additional data obtained directly from the state, InvestigateWest discovered which ballots were cured. The rejected and cured ballots combine to provide the total number of ballots that were challenged.
With the exception of Yakima County, none of this voter data includes race or ethnicity. InvestigateWest used a statistical package for R called eiCompare, that, among other features, infers a voter’s race or ethnicity based on surnames, demographics (like age and gender), and the level of geography selected by the data user.
InvestigateWest used voter age and county of residence in the “predict race” function. For each voter the output gives the predicted probability that they are one of five racial/ethnic groups: Asian, Black, Hispanic, other or white.
This output is a continuous variable ranging from 0% to 100% certainty. InvestigateWest classified a voter according to the highest value of predicted probability: If it said 0.49% white, and all of the other probabilities were less than 0.49%, then that voter is white in our data. The Washington State Auditor is currently using a similar method in a different statistical program and with finer geographic detail and racial categories in its own analysis. Dr. Loren Collingwood, associate professor at the University of New Mexico, reviewed InvestigateWest’s analysis.
Throughout the story, simple descriptive statistics are shown. However, InvestigateWest also ran many logit regression equations, similar to recent academic work.
The higher mismatch rates for Latino voters across each county and most age groups are not always statistically significant. One example of a highly significant finding: In Franklin County, the youngest Latino voters’ odds of a signature mismatch increase by more than 100% relative to Black + other + white voters (odds ratio of 2.14).
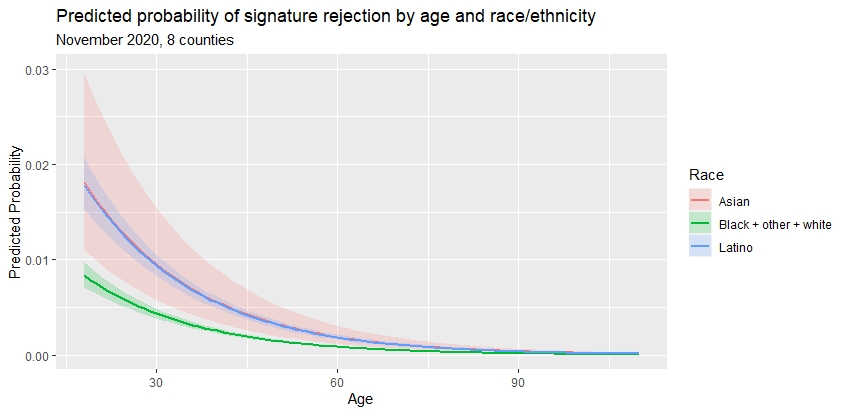
InvestigateWest ran an analysis like this visual for each county, and all eight counties together, looking at the predicted probability of a signature mismatch rejection or challenge. The visual above shows the probability of rejection for each of the three-category race/ethnicity variables, as age increases, holding years since registration constant. The curves include a shadow which is one standard deviation around the estimates. While the actual numbers vary, Black + other + white voters have a lower probability of rejection or challenge relative to Latino voters, with a gap that narrows as age increases. In some cases, predicted probability for Asian voters is the lowest of the three categories in the youngest ages, with the probability of rejection or challenge increasing with age.
Most of the data, research and reporting for this story should have been relatively simple to obtain or observe from the Washington Secretary of State, county auditors and elections offices. Sometimes it was readily available, but in other cases it was impossible to obtain or observe.
State law requires that a log of missing and mismatched signature ballots, in addition to a record of voter contacts, be maintained and accessible to the public. This provides the ability to easily see when the elections staff tried to contact voters, if or when those voters responded, and the count of challenged, cured and rejected ballots.
Compliance with this law at the county level ranges widely. Some counties could produce pieces of this information to InvestigateWest, but not all of it; they relied on the Secretary of State to try to fill in gaps or provided general statements on the timing of the first mail notice and the phone calls made three days before certification.
Some counties in Washington, like King and Yakima, have also changed their county canvassing board final signature rejection from an individual signature review to a batch approval based on staff recommendations. While an improvement in efficiency, this effectively removes public record of those individual signature decisions. King County has been doing this for at least 20 years.
Yakima County Auditor Charles Ross said his county chose the batch method in March 2020 out of concern for both subjectivity and voter privacy. “We leave the final recommendation to come from the two most senior trained signature folks in our shop. And it comes to this board as final approval,” he said.
County canvassing board meetings are public under state law. They do not attract a crowd, according to elections staffers, even without a pandemic. In Benton County in November 2020, InvestigateWest’s reporter was the only observer. An organizer with Latino Community Fund said she was the only observer at Franklin’s precertification meeting. And in Yakima, one community member and one other reporter attended the precertification meeting, in a small room with two red Xs taped on the floor for observers to stand for proper social distancing.
Other counties, like Douglas and Grant, did not have a large enough space to safely accommodate observers and comply with physical distancing guidelines. Grant live-streamed its precertification meeting without audio.
InvestigateWest did not witness the signature mismatch review in Benton County, but instead saw the county canvassing board review other types of challenged ballots. In this canvassing, the auditor, elections staff and county canvassing board members deliberated, looked up laws and procedures for unique cases, and sometimes sent ballots back to elections staff to do more research.
Correction: This story has been corrected to state that the eight counties studied had the highest share of potential Latino voters. Previously, it said the counties had the highest population of potential Latino voters.